plot_brain_slice
Usage
plot_brain_slice(
  df,
  title = NULL,
  fill_limits = "min_max",
  fill_low = "black",
  fill_mid = NULL,
  fill_midpoint = 0,
  fill_high = "white",
  legend_position = NULL,
  legend_title = NULL,
  slice_label_offset = 0.1
)
Arguments
- df
brain slice data (output of
plot_brain_slice())- title
title of plot (default: NULL)
- fill_limits
limits of the fill
- fill_low
color of the lowest limit (default: black)
- fill_mid
color of the midpoint. assigning a color automatically using
scale_fill_gradient2()ratherscale_fill_gradient()- fill_midpoint
midpoint value (default: 0)
- fill_high
color of the highest limit (default: white)
- legend_position
position of the legend (default: NULL). can also be 'bottom'
- legend_title
title of fill legend (default: NULL)
- slice_label_offset
slice label offset (default: 0.25)
See also
Other neuroimaging helpers:
compare_brains(),
convet_lut_fs2bids(),
extract_brain_slice(),
get_3dstats(),
plot_brain(),
split_dseg2mask()
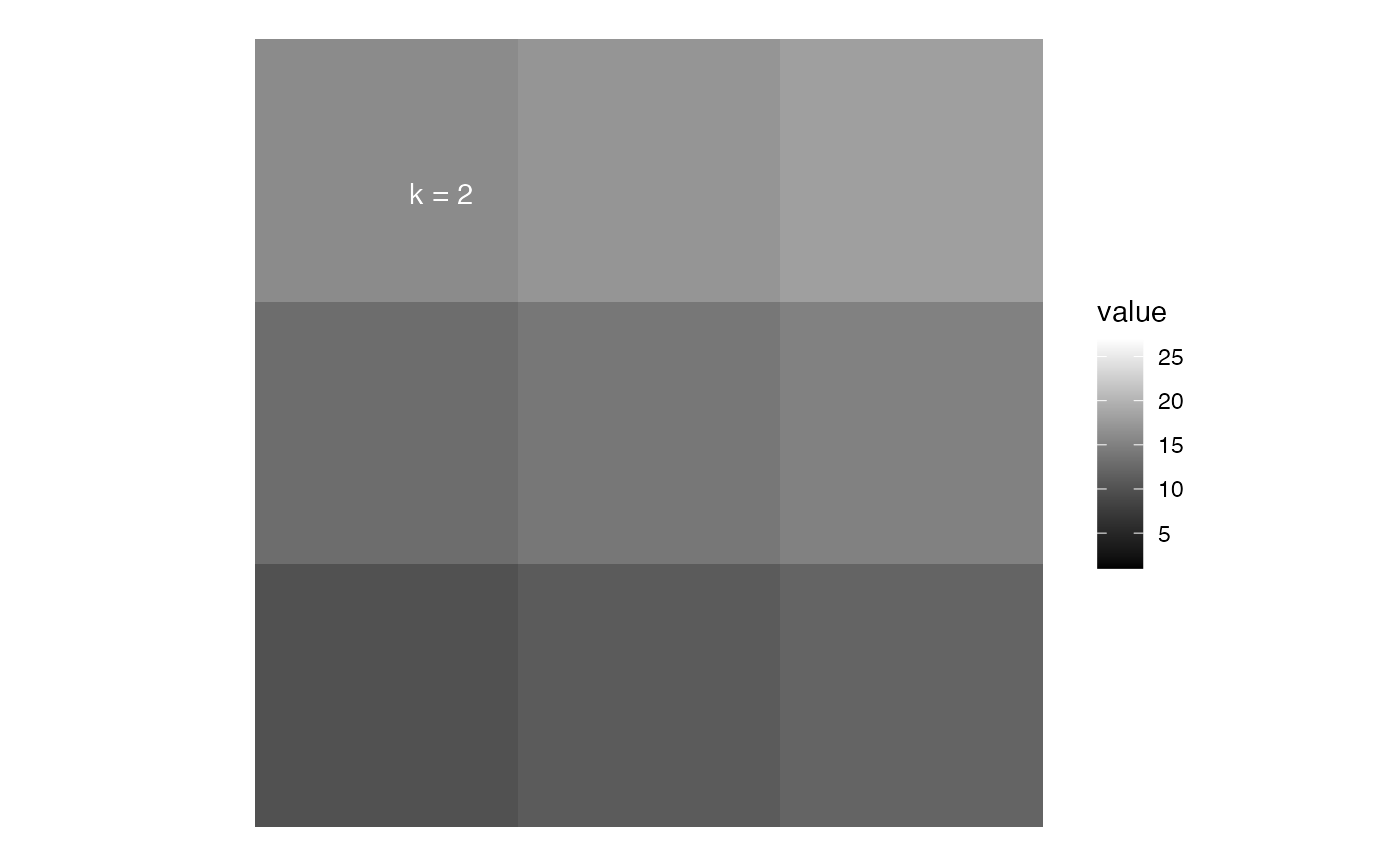
Examples
brain <- array(1:27, dim = c(3, 3, 3))
slice <- extract_brain_slice(brain, dir = "k", slice = 2)
plot_brain_slice(slice)