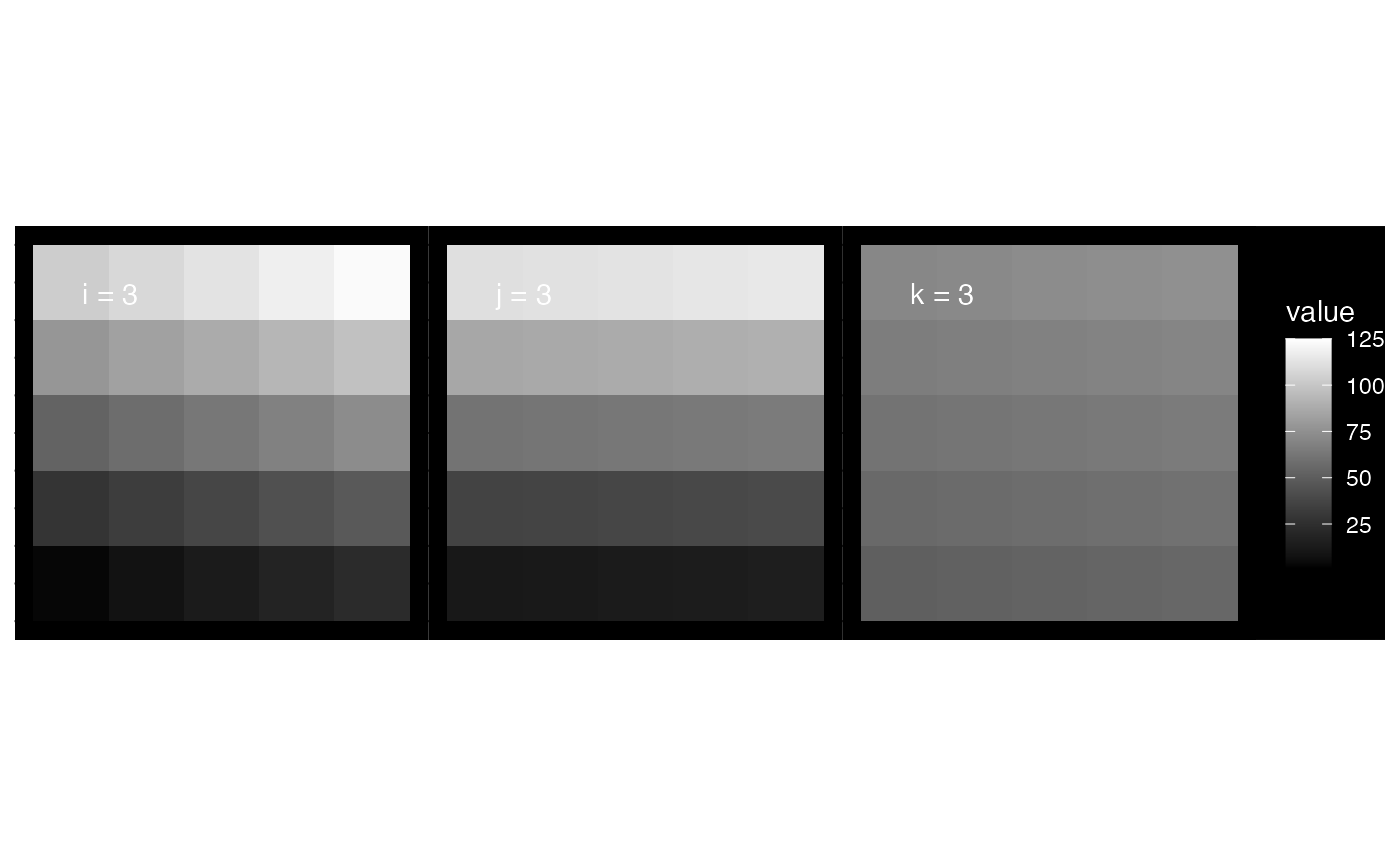
plot_brain
Usage
plot_brain(
  data,
  indices = NULL,
  legend_position = NULL,
  bg_color = "black",
  text_color = "white",
  out_path = NULL,
  out_width = 12,
  out_height = 3,
  ...
)
Arguments
- data
3D brain data
- indices
slices index of i, j, and k to plot
- legend_position
position of the legend can be bottom or NULL (default)
- bg_color
background color (default: black)
- text_color
text color (default: white)
- out_path
path to save image (default: NULL)
- out_width
width to saved image in inches (default: 11)
- out_height
height of saved image in inches (default: 8.5)
- ...
extra options to pass to
plot_brain_slice()
See also
Other neuroimaging helpers:
compare_brains(),
convet_lut_fs2bids(),
extract_brain_slice(),
get_3dstats(),
plot_brain_slice(),
split_dseg2mask()