plot_cor
See also
Other plotting helpers:
cor_plot(),
move_legend_to_btm(),
plot_age(),
plot_bland_altman(),
plot_cor_heatmap(),
plot_scree()
Examples
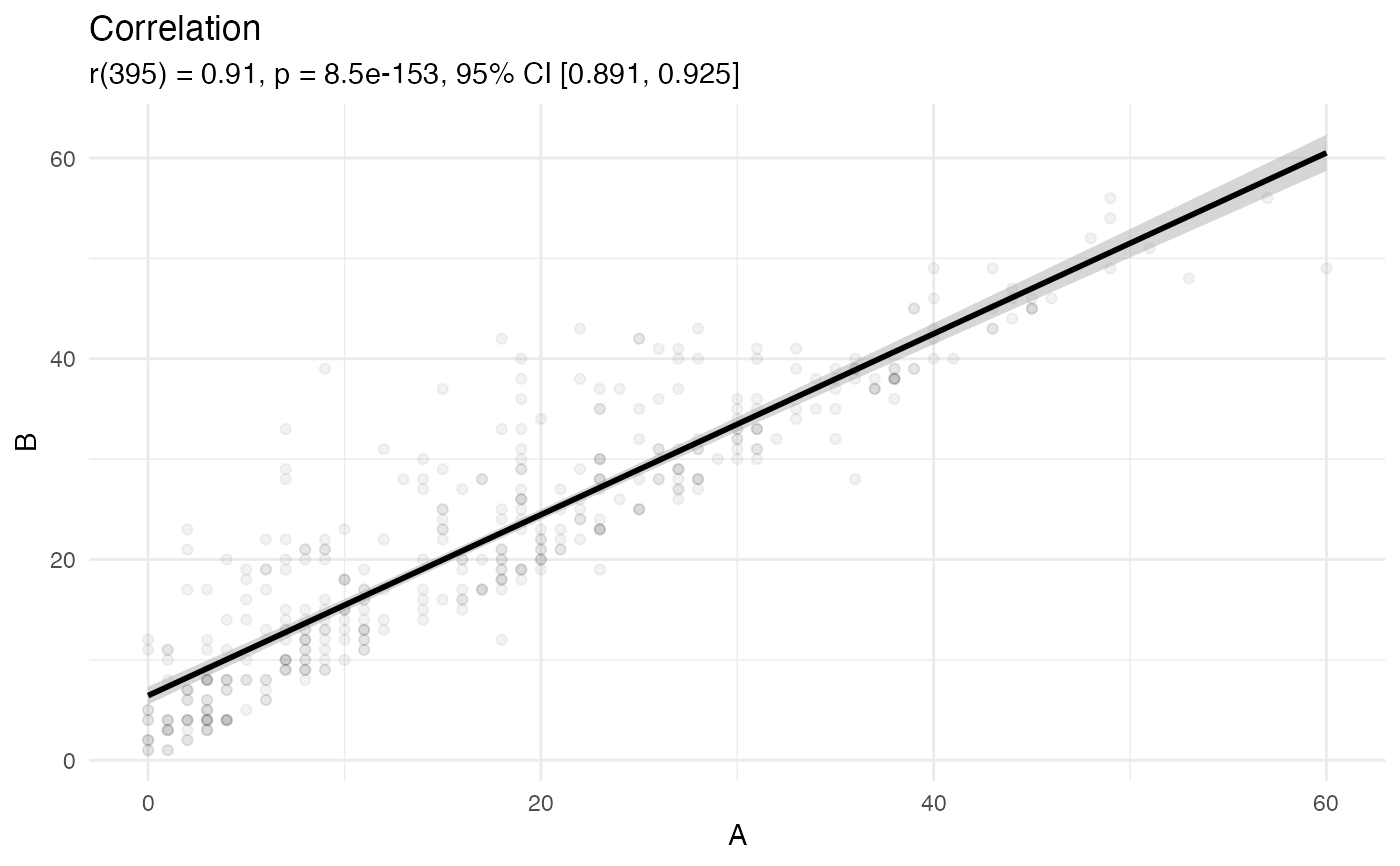
plot_cor('yrs.service', 'yrs.since.phd', carData::Salaries)
#> `geom_smooth()` using formula = 'y ~ x'