plot_age
See also
Other plotting helpers:
cor_plot(),
move_legend_to_btm(),
plot_bland_altman(),
plot_cor(),
plot_cor_heatmap(),
plot_scree()
Examples
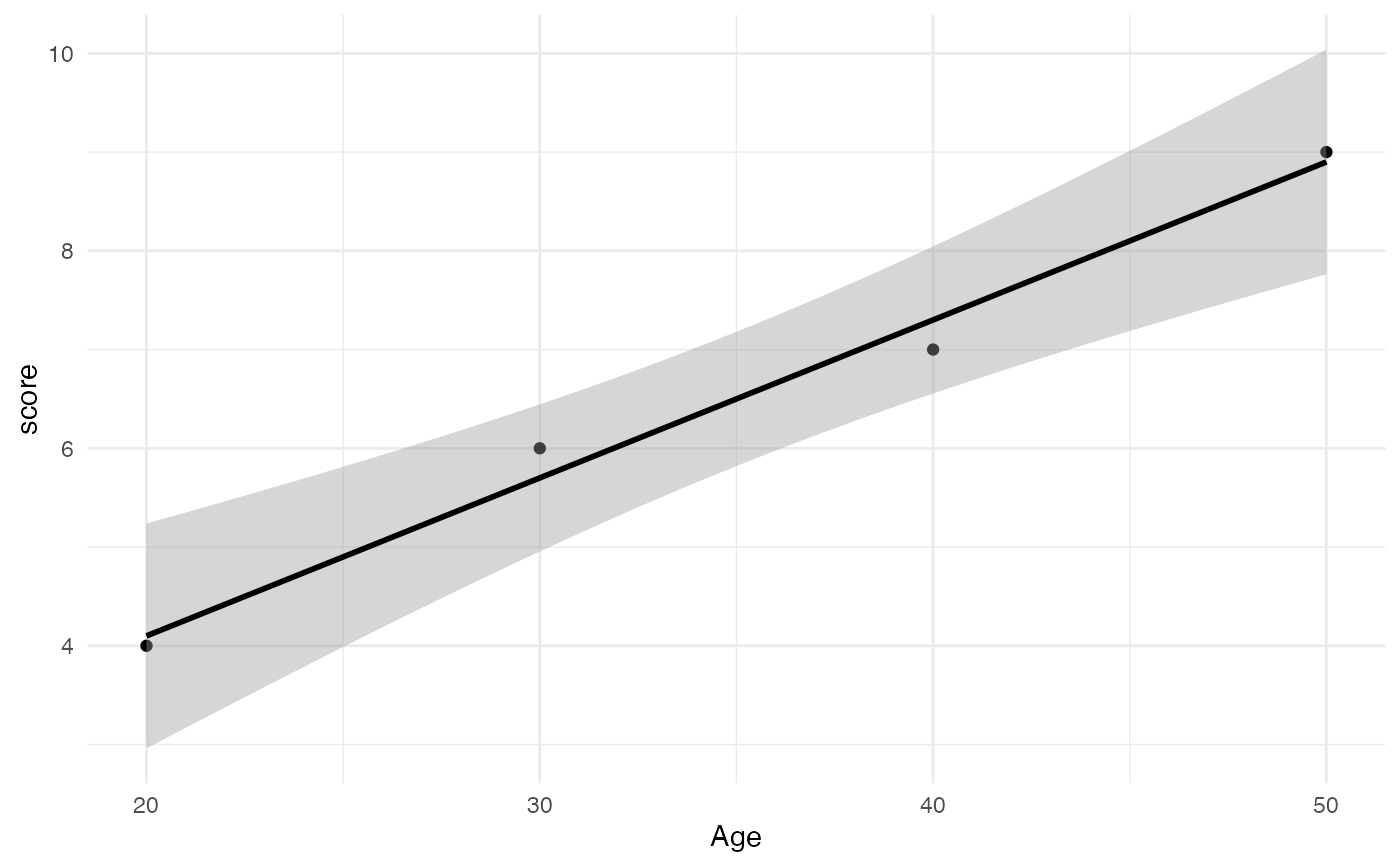
data <- data.frame(age = c(20, 30, 40, 50), score = c(4, 6, 7, 9))
plot_age(data, y_var = "score")
#> `geom_smooth()` using formula = 'y ~ x'