plot_longitudinal_slopes_by_age
plot_longitudinal_slopes_by_age.Rdplot_longitudinal_slopes_by_age
plot_longitudinal_slopes_by_age(
  data_long,
  variable,
  age_var = "age",
  sub_var = "sub",
  wave_var = "wave"
)
Arguments
| data_long | Data in person-period format |
|---|---|
| variable | Variable to plot |
| age_var | Name of age variable |
| sub_var | Name of subject ID variable |
| wave_var | Name of wave variable |
Value
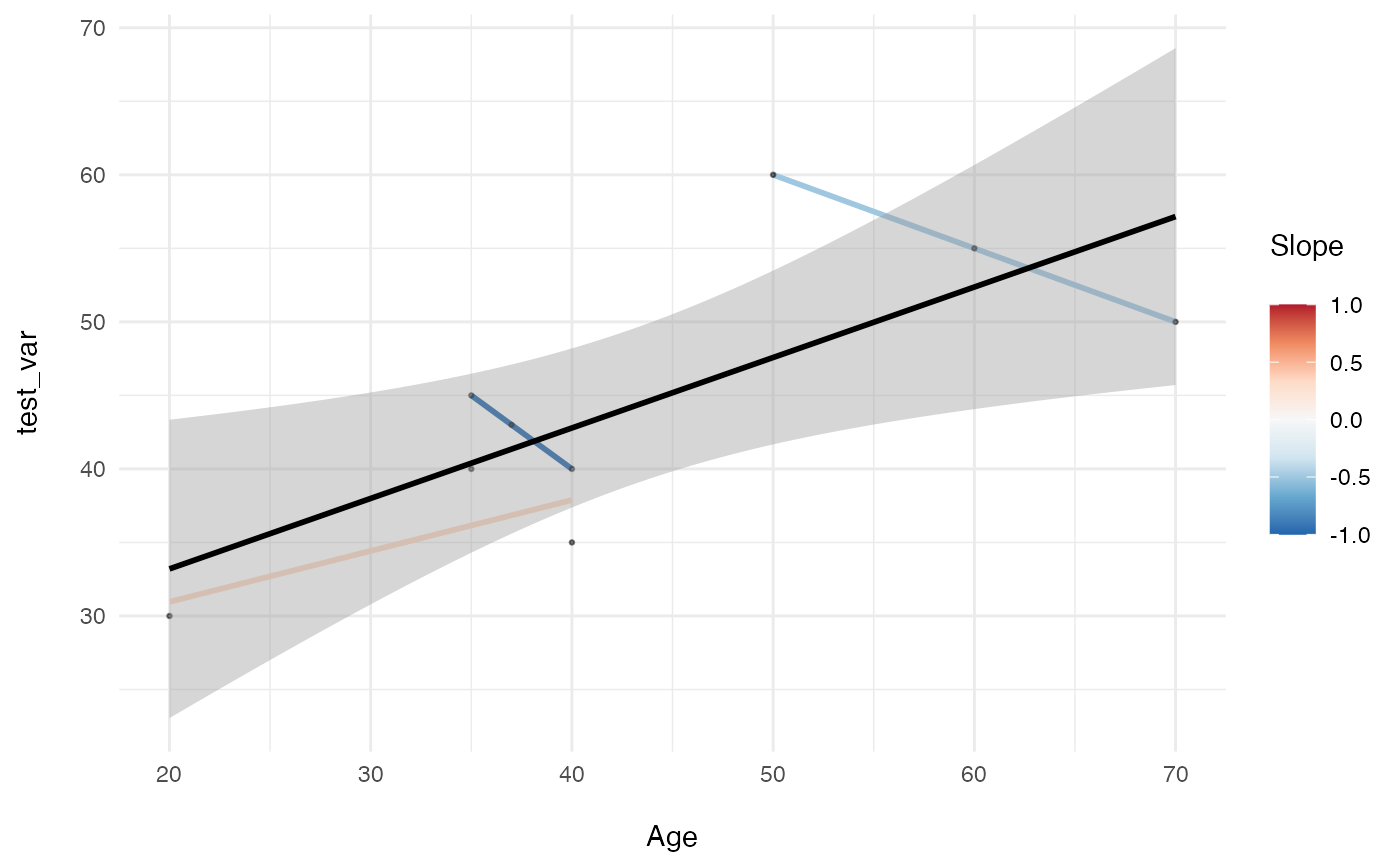
plot with y-axis of variable and x-axis of age. lines and colors are estimated slopes within sub_vars (i.e., slopes represent change in variable over time)
Examples
df_fake <- data.frame(sub = c(1, 1, 1, 2, 2, 2, 3, 3, 3), wave = c(1, 2, 3, 1, 2, 3, 1, 2, 3), age = c(50, 60, 70, 20, 35, 40, 35, 37, 40), test_var = c(60, 55, 50, 30, 40, 35, 45, 43, 40)) plot_longitudinal_slopes_by_age(df_fake, 'test_var')#> Warning: There were 2 warnings in `mutate()`. #> The first warning was: #> ℹ In argument: `estimates = map(...)`. #> ℹ In group 1: `eval(as.name(sub_var)) = 1`. #> Caused by warning in `summary.lm()`: #> ! essentially perfect fit: summary may be unreliable #> ℹ Run `dplyr::last_dplyr_warnings()` to see the 1 remaining warning.#>