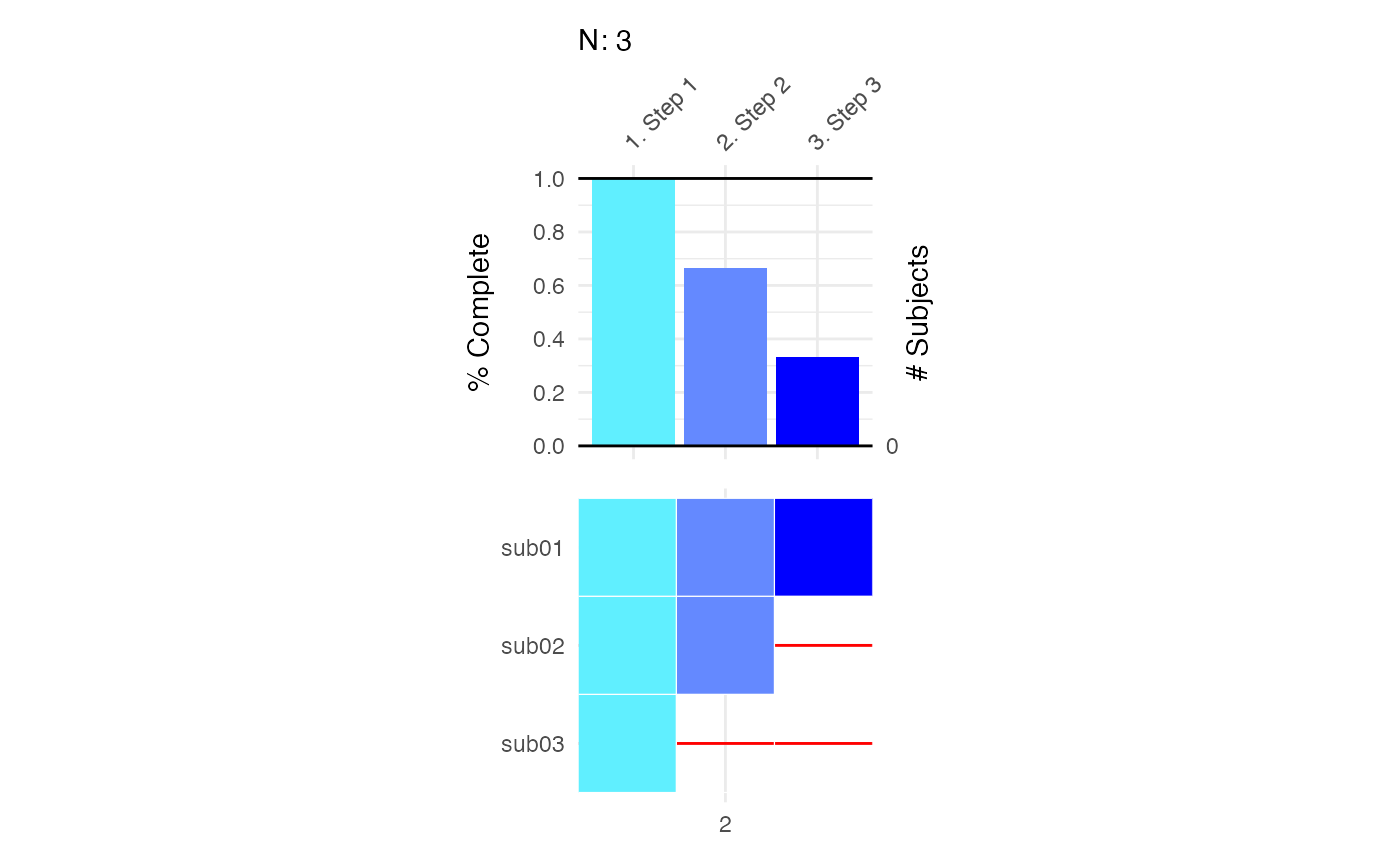
plot_steps
Arguments
- data
path to input csv file of subjects by rows (character) OR a data.frame containing the data (required)
- out_path
path to save output image (optional)
- subjid
columns that identify the rows. if more than one, will combine into key1-value1_key2-value2_...keyN-valueN
- title
title of plot
- subtitle
subtitle of plot
Examples
df <- data.frame(
  sub = c("sub01", "sub02", "sub03"),
  `1. Step 1` = c(1, 1, 1),
  `2. Step 2` = c(1, 1, 0),
  `3. Step 3` = c(1, 0, 0),
  check.names = FALSE
)
plot_steps(df)
#>
#> step:
#> ✓ 1. Step 1
#> ✗ 2. Step 2
#> ✗ 3. Step 3
#>
#> steps incomplete:
#>   subjid 1. Step 1 2. Step 2 3. Step 3
#> 2  sub02         1         1         0
#> 3  sub03         1         0         0
#>
#> no. subjects incomplete:	 2